








The statusline is an opt-in row at the very bottom of the TUI. gori runs a shell command on an interval and renders its stdout as that row — a status bar you write yourself, inspired by Claude Code's status line. It ships off, and the statusline section stays out of settings.json until you change something.
Turning it on
Open Preferences with Ctrl-,, go to General, and the Statusline rows are there: Enabled, the Command field, and the Interval and Timeout seconds. Type a command into the field and the row appears under the status bar.
The same thing in settings.json:
{
  "statusline": {
    "enabled": true,
    "command": "date '+%H:%M'",
    "interval": 3,
    "timeout": 10
  }
}
That is a clock: the shape is the point, and what belongs in command instead is the rest of this page.
Every key, its default and its exact meaning: statusline in the configuration reference.
Three things worth knowing before you write one:
- Only the first line of stdout is used, truncated to the terminal width. A script that prints a paragraph draws its first line and nothing else.
- ANSI/SGR colour escapes are honoured — 16-colour, 256-colour and truecolor, plus bold, underline and friends — so the row can be coloured segments rather than one flat string.
- Edits take effect immediately. Saving a new
command,intervalortimeoutre-runs the command on the next frame instead of waiting out the current interval.
It never blocks the UI: runs happen off the draw path, and they never overlap — gori launches the next one only after the previous has finished.
Presets
The top bar already carries what gori knows about itself: the project, capture state, the address it is bound to, the scan mode. A statusline earns its row by saying what the bar cannot — something from outside gori, or something gori holds but does not count for you.
Each of these is one line and goes straight into command, because the settings form's
field is one line too. \u001b is how jq spells the escape character; the colours are
optional. Under each command is the row it actually produced.
jq -rn --argjson exp "$(gori run jwt "$(cat "${GORI_HOME:-$HOME/.gori}/token.jwt")" --format json | jq .payload.exp)" '(($exp - now) / 60 | floor) as $m | if $m < 5 then "\u001b[31m⚠ token \($m)m left\u001b[0m" else "\u001b[32m●\u001b[0m token \($m)m left" end'

Keep the bearer token under test in a file and the row counts it down, turning red under five minutes — before a sweep starts coming back 401 and you spend ten minutes debugging the wrong thing. Any JWT tool would do here; gori has one.
p=$(jq -r .project); gori run history --project "$p" -q 'status:>=500' --format json 2>/dev/null | jq -rs 'length | if . == 0 then "" else "\u001b[31m\(.) × 5xx\u001b[0m" end'

A History query on a timer. It asks the whole project, not the rows History happens to be filtered to, and it prints nothing while the target is healthy — so the row appears the moment you break something.
p=$(jq -r .project); gori run notes --all --project "$p" | awk '/^- \[ \]/ { n++; if (n == 1) first = substr($0, 7) } END { if (n) printf "todo %d · %s", n, first }'

The `- [ ]` items in the project's notes, counted, with the first one spelled out. Your checklist stays in front of you instead of in a tab you have to go and open.
Everything in the context is fair game too — \(.flows), \(.issues), the
mode flags — but read the top bar first: a segment that repeats a chip costs you a row and
tells you nothing. The shape that pays is the one above, gori's own data crossed with
something gori has no way to know:
# The project, and the branch you are testing it from.
printf '%s · %s' "$(jq -r .project)" "$(git branch --show-current 2>/dev/null)"
When one line is not enough
Past a segment or two, command stops being a field you type into and becomes a script you
keep. Point it at one:
{
  "statusline": {
    "enabled": true,
    "command": "sh \"${GORI_HOME:-$HOME/.gori}/statusline.sh\"",
    "interval": 5
  }
}
#!/bin/sh
# statusline.sh — one row: how long the token has, whether the target is erroring,
# and what is still unchecked. The context arrives on stdin, so read it once.
ctx=$(cat)
project=$(printf '%s' "$ctx" | jq -r .project)

token=$(jq -rn --argjson exp "$(gori run jwt "$(cat "${GORI_HOME:-$HOME/.gori}/token.jwt")" --format json | jq .payload.exp)" \
  '(($exp - now) / 60 | floor) as $m | if $m < 5 then "\u001b[31m⚠ token \($m)m left\u001b[0m" else "\u001b[32m●\u001b[0m token \($m)m left" end')
errors=$(gori run history --project "$project" -q 'status:>=500' --format json 2>/dev/null |
  jq -rs 'length | if . == 0 then "" else "\u001b[31m\(.) × 5xx\u001b[0m" end')
todo=$(gori run notes --all --project "$project" |
  awk '/^- \[ \]/ { n++; if (n == 1) first = substr($0, 7) } END { if (n) printf "todo %d · %s", n, first }')

printf '%s' "$token"
[ -n "$errors" ] && printf '   %s' "$errors"
[ -n "$todo" ] && printf '   %s' "$todo"
printf '\n'
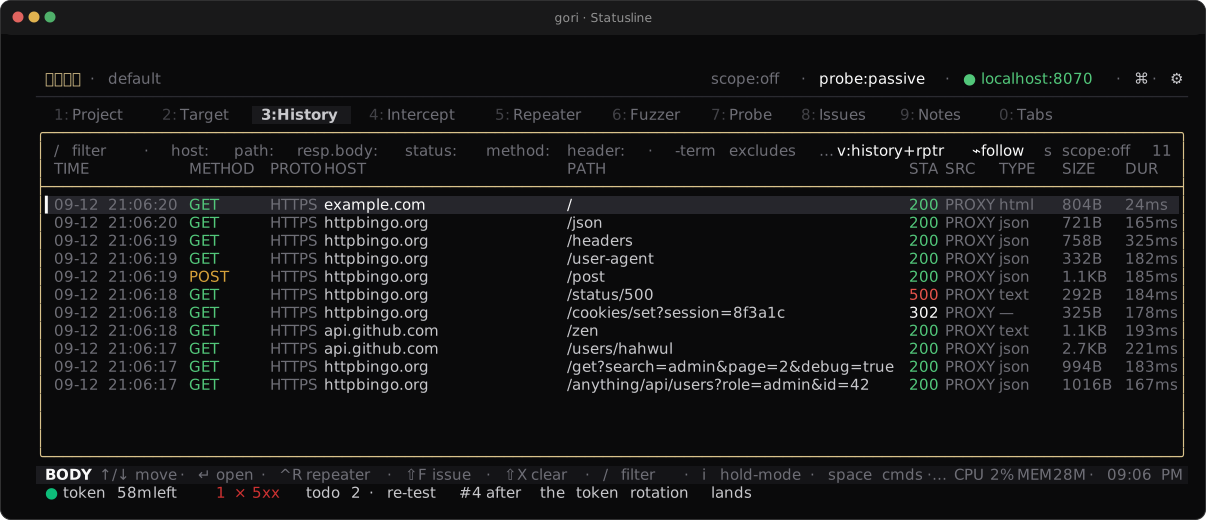
That is the row in the shot at the top of this page: the three presets above, joined, with
each part printed only when it has something to say. Two things make it work — the context is
read once into $ctx, because stdin is a pipe (see above), and the last
statement is a plain printf, so a quiet run still exits 0 rather than reporting ⋯ (exit 1).
Give it interval: 5 or more: the script spawns three short-lived processes per run, which is
nothing next to a browser but is not worth doing every second.
The context on stdin
Each run receives a JSON context on stdin describing the live session, so scripts can display proxy state without querying gori:
{
  "version": 1,
  "project": "acme",
  "capturing": true,
  "flows": 1234,
  "proxy": { "host": "127.0.0.1", "port": 8070, "addr": "127.0.0.1:8070" },
  "upstream": "",
  "upstream_rules": 0,
  "scope": { "active": true, "rules": 2, "sandbox": false },
  "intercept": { "enabled": false, "queued": 0, "direction": "both" },
  "probe": "passive",
  "issues": 7,
  "jobs": { "running": 1, "label": "fuzzing 1" }
}
| Field | Type | Description |
|---|---|---|
version |
integer | Context schema version (currently 1) |
project |
string | Active project name |
capturing |
bool | Whether the proxy is currently capturing |
flows |
integer | Number of captured flows |
proxy.host / proxy.port / proxy.addr |
string / integer / string | The address the proxy is actually listening on |
upstream |
string | The catch-all upstream proxy address/URI, or empty when connecting directly. A destination matched by an upstream rule routes elsewhere; this field does not reflect that |
upstream_rules |
integer | Number of upstream rules in effect. Non-zero means routing is per-destination and upstream alone does not describe where traffic goes |
scope.active / scope.rules |
bool / integer | Whether scope filtering is actually in force — the lens is on and at least one rule exists — and how many rules there are |
scope.sandbox |
bool | Whether the Sandbox is blocking out-of-scope destinations outright, rather than merely not recording them |
intercept.enabled |
bool | Whether catch is on. Real clients are held while it is |
intercept.queued |
integer | Messages waiting for a decision right now |
intercept.direction |
string | both, requestonly or responseonly — which leg is caught |
probe |
string | The scanner mode: off, passive, active or aggressive |
issues |
integer | Issues recorded in this project |
jobs.running |
integer | Background jobs in flight (fuzz, mine, discover, …) — the same book the activity chip counts, so an in-flight Repeater send is not one |
jobs.label |
string | null | What the status bar's activity chip says, e.g. "fuzzing 1"; null when nothing is running |
Everything from scope down describes what gori is set to do next rather than what it has already captured — the same facts the top bar's chips carry, so a statusline can answer "is intercept still on?" without you looking up. The fields are additive and version stays 1: a script written against an earlier context reads identically.
stdin is read once. It is a pipe, not a file, so the first command that consumes it gets everything and the second gets nothing — "$(jq -r .project)" "$(jq -r .flows)" silently prints an empty flow count. Read the whole context with one jq, as the presets above do, or capture it first:
ctx=$(cat); printf '%s · %s flows' "$(echo "$ctx" | jq -r .project)" "$(echo "$ctx" | jq -r .flows)"
When the command fails
A command that fails without printing anything reports its exit status instead of leaving the row blank: ⋯ (exit 127) for a command that was not found, ⋯ (killed) for one a signal ended. A run that overruns timeout is terminated and the row reads ⋯ (timed out). A command that exits cleanly having printed nothing leaves the row empty, which is a legitimate thing for a script to do. stderr is discarded either way.
Every one of these markers is drawn in the caution colour rather than in body text, so a statusline that has stopped working never reads as one reporting bad news.
timeout is deliberately separate from interval. Because runs never overlap, a script slower than interval simply refreshes as fast as it can rather than being killed on every run; only timeout ends one.
A command that backgrounds work (curl … &) must clean up after itself: gori kills the /bin/sh it started, and cannot reach anything that shell forked — it shares gori's own process group, so signalling the group would take gori down with it. A timed-out run is sent SIGTERM before SIGKILL, so a trap … TERM around cmd & wait gets to tidy up; the simpler answer is to bound the command itself (curl --max-time 2, timeout 2 …).
Where else a command can run
The statusline is one of five settings that carry a command rather than data. The others are process hooks and the external editor; a profile exported with gori settings export can carry all of them, and both ends of that transfer say so.