








gori includes automated analysis that runs alongside your manual testing. Probe watches traffic for issues, the Param Miner discovers hidden inputs, and Issues is where results get triaged.
Probe: the Scanner
Probe groups security issues by type and severity. Its passive checks run as you browse (with zero extra requests), inspecting History flows and Repeater send results.
Its active checks are deliberately light-touch: a handful of safe, low-volume probes over traffic you've already captured. By default only safe methods (GET / HEAD) are probed, each unique surface is tested once, and the automatic pipeline sends nothing until you arm active mode: press m on the Probe tab (Set mode), or run gori run probe mode active. A new project starts in passive. A per-flow Run active scan is a deliberate one-off that runs in any mode and re-tests a surface already seen. It's built to confirm a quick hunch (a parameter reflects, an origin is honored) while keeping your footprint quiet.
Re-sending an unsafe method (POST / PUT / PATCH / DELETE) can mutate server state, so it is always opt-in. Tick unsafe methods in the per-flow Run active scan popup for a single deliberate re-send, or switch Probe to AGGRESSIVE mode, which also probes unsafe methods automatically and raises the per-rule caps (wider param sets, a wider forbidden-bypass header set, and for the SQL injection rules a numeric-context true/false pair and PostgreSQL and MSSQL delays alongside MySQL's). AGGRESSIVE stays inside your project scope, so its automatic pipeline never touches an out-of-scope host; the per-flow popup is your explicit choice of flow and is not limited to scope-included hosts, but the sandbox and exclude rules still block it.
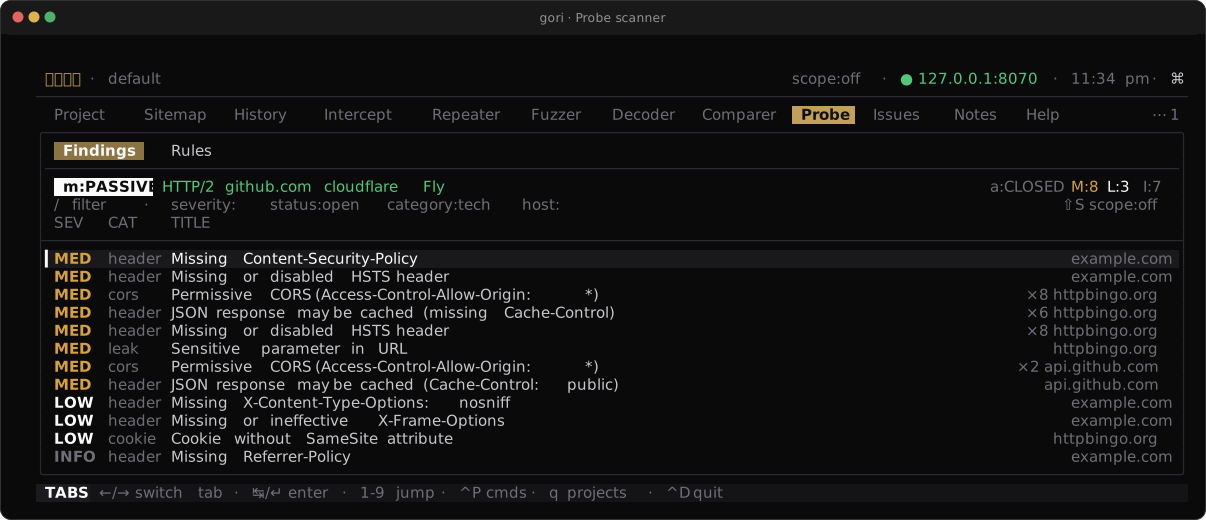
| Category | What it covers |
|---|---|
headers |
Security headers (HSTS, CSP incl. report-only-only, XFO, Permissions-Policy, …), cleartext Basic auth, a password submitted or a login form served over http://, mixed content, cacheable API responses, a Set-Cookie a shared cache may store, MIME-type confusion (an HTML body under a sniffable type with no nosniff, JSON served as text/html), JWT weaknesses (alg:none, non-standard alg, no exp, a key-injection jku/x5u/jwk header), cross-origin subresources without integrity, a response head with bare-LF line endings (a desync precondition) |
cookies |
Secure / HttpOnly / SameSite and related cookie hygiene |
tech |
Technology and protocol fingerprints (also surface on the Project tab) |
infoleak |
Body disclosures, secrets in URLs / WS frames, GraphQL introspection, source maps shipped with production scripts, directory listings, sensitive JWT claims, exposed configuration and diagnostic artifacts (.env, .git/config, phpinfo(), .htpasswd, wp-config credentials, Spring actuator env), framework debug mode and interactive debuggers reachable in production (Symfony, Werkzeug/Flask, Django, Laravel, Rails, ASP.NET), a suspected subdomain takeover, an internal hostname or RFC 1918 address in a response header, and native-serialization blobs in cookies / parameters / hidden fields (Java, .NET BinaryFormatter/ViewState, PHP), the insecure-deserialization surface, exposed API documentation / schema and interactive GraphQL IDEs (Swagger UI, OpenAPI/Swagger specs, GraphiQL, GraphQL Playground, ReDoc), and a known framework session identifier carried in the request URL |
cors |
Wildcard / null origin / credentialed misconfigurations; a reflected origin cached without Vary: Origin; active origin reflection; a permissive Flash/Silverlight cross-domain policy (domain="*") |
client |
Client-side suspicions in page and bundle scripts: DOM-based XSS (source into sink), DOM clobbering, prototype pollution, and postMessage weaknesses. Heuristic, so treat as leads to confirm |
active |
Confirmed by a light-touch probe: reflected parameters, backslash-powered injection points, open redirect, CRLF/response-header & host-header injection, access-control bypass (spoofed client-IP / path normalization / URL-rewrite headers), NGINX alias & parameter path traversal, server-side template injection, and Next.js server-action missing authorization (re-sends a Next-Action request with the session cookie/Authorization stripped; needs unsafe/AGGRESSIVE, since actions are POST), error-based SQL injection (a syntax-breaking payload per parameter, flagged when a database-error signature appears in the probe but not in the clean baseline), boolean-based blind SQL injection (an always-true and an always-false breakout per parameter, flagged when the true leg matches the baseline and the false leg does not), time-based blind SQL injection (off by default; see below), and blind SSRF confirmed out of band: a URL parameter is pointed at an OAST payload and the finding is raised when the server calls back. Blind OS command injection is confirmed the same way: a shell-breakout payload is appended to a command/diagnostic parameter (cmd, ping, host, …) and the finding is raised when the server's shell calls the OAST listener back. Remote file inclusion is probed the same way on include-shaped file, page, template and locale parameters, with a language-marked OAST resource and a callback as confirmation. XML external entities (xxe_oast) are confirmed by callback too (see below). GraphQL introspection is confirmed actively too (recorded under infoleak). Access-control bypass also covers HTTP-method tricks: a method case variant (gET) by default, plus method-override headers (X-HTTP-Method-Override) and alternate verbs under the unsafe opt-in. A rate-limit bypass re-sends a 429 request with a spoofed client-IP header and flags it when the request is then served while a clean control is still rate-limited. Insecure HTTP methods sends OPTIONS and TRACE to flag Cross-Site Tracing (TRACE echoing the request) and dangerous methods advertised in Allow |
Every built-in rule is listed by id, with its category and its request cost, in the Probe rules reference; those ids are what gori run probe rules enable/disable take.
Some active rules do not behave like the rest, and the Rules sub-tab says so on the row:
- HTTP request smuggling (CL.TE / TE.CL / TE.TE desync) ships disabled. It sends incomplete framing probes with POST bodies and confirms a front-end/back-end desync by a timing hang, which is a heavier and less polite thing to do to a target than any other rule here. The row is badged
opt-in; arm it deliberately withgori run probe rules enable request_smuggling, and read the differential confirm as an--aggressive --unsafestep. Even enabled, it builds no probe without unsafe methods (the popup's opt-in,--unsafe, or AGGRESSIVE), because every probe is a POST. - Time-based blind SQL injection (
sqli_time_based) also ships disabled, because each confirming leg waits several seconds of wall-clock time. Enable it from the Rules sub-tab or withgori run probe rules enable sqli_time_based. It sends two clean baselines, then a 2-second and a 4-second injected delay (MySQLSLEEPby default; AGGRESSIVE addspg_sleepandWAITFOR DELAY), and fires only when the response time grows with the requested delay, so an endpoint that is merely slow does not trip it. An endpoint whose two baselines already disagree by as much as the signal is skipped rather than measured. - Out-of-band rules (blind SSRF, blind OS command injection, XML external entities, remote file inclusion) ship enabled but inert: they can only send once the project has a registered OAST listener to mint a payload from. That is a capability, not a toggle, so the row is badged
needs OASTand its request cost stays out of the estimate until a listener exists.
Blind SSRF tests only the first URL-shaped value across the query, form fields and top-level JSON strings, using one request. RFI uses the same one-slot budget for the first path/URL/filename-shaped value or conventional include parameter, and carries PHP/JSP/ASP marker variants in the OAST URL. Unsafe methods still need explicit opt-in. The xxe_oast rule also needs unsafe opt-in and sends one XML request containing an external parameter entity reference; it reports only after an OAST callback. It preserves the original document and skips existing DTDs, compressed or chunked requests, truncated bodies, bodies over 64 KiB, and unsupported encodings. These checks do not try payload lists or send confirmation retries.
Custom rules add your own checks under the custom category: a string, a regex, or a command tested against one region (request or response; whole, header or body) of every captured flow, raising a finding on a hit. On the Rules sub-tab a adds one, e or ↵ edits it, d deletes it, t toggles any rule and / filters the list; headless it is gori run probe rules add, delete, enable and disable.
Severities run info, low, medium, high, critical. Headless gori run probe runs passive checks by default, and pass --active to also run active checks.
Findings are grouped by check and host, so one row can stand for dozens of hits. Open it and the AFFECTED URLS list is the evidence: ↑/↓ walk it and Enter opens the flow that URL was captured on, in the same detail view History uses. s goes to the source (the finding's sample flow, in History), r sends it to the Repeater, and y copies the selected URLs (or all of them).
Run analysis headless. By default it reads what's already captured (History + Repeater responses) and sends nothing, or pass --active to send probe requests:
gori run probe                       # passive issues
gori run probe --active              # include active checks (sends probe requests)
gori run probe --active --unsafe     # also re-send unsafe methods (may mutate server data)
gori run probe --active --aggressive # wider caps + unsafe methods (authorized targets only)
gori run probe --severity high       # high and critical (a floor)
gori run probe --category cors       # a single category
gori run probe -q 'host:example.com' # filter History with QL (Repeater still scanned)
gori run probe --persist             # also write the findings into the triage list
Web cache deception
gori run cache-deception <flow-id>… (MCP cache_deception_check) checks whether a private response can be served to someone else from a cache. For each flow it replays the request as its captured, logged-in identity to prime any cache, requests the same URL again with Cookie and Authorization removed, and, only when that anonymous response matched and came from a cache hit, sends an anonymous control with a cache-busting query. The verdict is cached when the anonymous request got the authenticated content from a cache hit and the control was refused (401/403) or redirected (a likely deception; confirm the body was really private), served when the content matched without a cache hit or the control matched too without one (the content looks public), review when the answer was only similar, the control was a cache hit too (the buster may have been ignored), or the control failed some other way, such as a 404 or 5xx caused by the buster, and protected when the anonymous request did not get the authenticated response; blocked and errored mean nothing was measured. Only GET/HEAD/OPTIONS are checked unless you pass --unsafe-methods. To find the crafted paths worth checking, sweep a path with the Fuzzer's cache-delimiters preset, and filter History with the cache: QL field.
Param Miner
The Miner discovers parameters a server accepts but doesn't advertise. Point it at a flow and it probes candidate names across locations: query string, form body, multipart/form-data, JSON (including nested objects and array roots), headers, and cookies. It buckets guesses efficiently and reports the ones that change the response. Multipart is applicable but off by default (a captured file part would be re-sent on every request); enable it with --locations multipart or its checkbox. A --wordlist (MCP wordlist) is a file, or the name of a list in the wordlist catalog. Names you already have go first: --name (repeatable; MCP mine_start names) tests them ahead of the wordlists, and m (Mine parameters) on the Target → Params sub-tab mines the selected endpoint with the names seen on its origin's other endpoints first.
gori run mine <flow-id> \
  --locations query,headers \
  --wordlist params.txt \
  --bucket 50
A mine is latency-bound rather than CPU-bound (it sends a bucket, waits, bisects, waits), so what it mostly costs is round trips. Two things keep that count down: the run reuses one connection across its probes (one TCP, and on https one TLS, handshake per worker instead of one per probe; turn it off with the reuse connections checkbox, --no-keep-alive, or keep_alive: false when the target behaves per-connection), and every location is mined through one shared pool of workers, so three locations do not cost three times one location and the tail of a bisection no longer runs alone.
A target that rotates a CSRF token or nonce per request rejects every probe that carries a stale one, the baseline first, so the mine reports nothing or everything. Give the run a request-time macro (--macro, MCP macro_steps, or the macro step row of the mine popup): saved Repeater sessions that run before each request and leave a fresh value in the session bindings.
The Miner tab is off the bar by default. Press
0to open it, or give it a slot insettings:tabs.
Discover: Spider & Brute-Force
Where the Miner finds hidden inputs, Discover finds hidden endpoints. It spiders a target (following links you never clicked) and brute-forces unlinked directories and paths (/admin, .git/config, /api/v2). It lives as a sub-tab under the Target tab, next to the Sitemap, and every endpoint it finds flows straight into that Sitemap.
Start a run from where you already are: on a Sitemap node or a History flow, press Space > D (Send flow to… → Discover here on the Sitemap, Discover from flow in History). A small popup lets you choose the exploration style (spider, brute-force, or both, the default), a max depth, the crawl scope, and concurrency. The run happens in the background: watch the bottom bar, pause or stop it from the Discover sub-tab (^X stop, p pause), and jump to the results from the completion notification.
A finished run is more than a list of URLs. Every finding is stored with the request Discover framed and the response the origin sent back, so in the FINDINGS table Enter (or o) opens that exchange in the same detail view History uses: headers, body, pretty-printed JSON, and from there ^R to the Repeater. Headless runs and MCP runs store the same bytes, so a finding is openable with gori run show or get_flow too.
Discover is built for tight false-positive and false-negative rates on real sites:
- It reads what the target says about itself. Every spider run fetches the well-known documents at the origin (
robots.txt,sitemap.xmlandsitemap_index.xml, the.well-known/registry (openid-configuration,oauth-authorization-server,oauth-protected-resource,security.txt,apple-app-site-association,assetlinks.json,host-meta,change-password), and the API's own description of itself (openapi.json,swagger/v1/swagger.json,v3/api-docs,v2/api-docs)) and crawls the endpoints they declare. An OIDC discovery document alone hands over the authorize, token, userinfo, JWKS, revocation and registration endpoints; an OpenAPI document enumerates every route the service exposes, including the ones behind auth. These are guesses at fixed paths, so they go through the same soft-404 baseline a wordlist hit does. - It reads your JavaScript. The spider follows
<script src>like any other link, and now parses the bundle it gets back: quoted root-relative paths and absolute URLs become crawl targets. On an SPA, the API routes are reachable only from JS and by construction unlinked, so this is the surface both the spider and the brute-forcer used to miss entirely. The same pass runs over inline<script>blocks, JSON responses and source maps. - It reads what the brute-forcer finds. A wordlist hit's body is parsed for endpoints too, so finding
swagger.jsonor an autoindex page is the start of a crawl rather than a single row. Only hits are read, so the thousands of soft-404s a sweep sends cost nothing. - It reads the response headers.
Link(how a paginated API names its next page, and nowhere else),Content-Location,Refresh, and thePathaSet-Cookiescopes itself to (the application saying which subtree it is mounted under, exactly the kind of unlinked directory this engine is for). - A
405counts as an endpoint. A form target, a JSON API that only takesPOST, a WebDAV collection: reached byGETonce, answering405, and dropped by every crawler that reads4xxas absent. They are also the endpoints most worth testing. - Soft-404 calibration. Before brute-forcing a directory it sends a few known-bad paths to learn how that server answers a miss. It handles a custom-designed error page on a real
404, a server that returns200for everything, one that quotes the requested path back into its error page, and one that redirects every unknown path to/login, so a wordlist hit only counts when it genuinely diverges from that baseline. Each of those behaves differently under the same wordlist, so the run tells you which one it found (wildcard-200 (echoes path), and so on). - The baseline is re-measured when the target changes its mind. A baseline is taken once per directory, and a rate limiter, a WAF block page or a
5xxmeltdown partway through a sweep makes every remaining probe look like a discovery, the classic way an automated sweep produces hundreds of confident findings that are all the same block page. Discover watches for a run of probes that all clear the baseline and all look identical, holds those results back rather than reporting them, and re-measures the directory. What it dropped is reported asdriftin the run summary, so a directory that went unmeasured never reads as a directory that was empty. - No runaway crawls. Two independent guards stop a crawl from exploding: URL-shape folding collapses
/user/1,/user/2,/user/3… into one template, and a content fingerprint collapses near-duplicate listing pages into one cluster. A depth cap, a page cap, and a hard request budget bound the rest. - Scope-aware by default. A run stays on the seed origin unless you've set Scope include rules, in which case it follows them; Scope excludes and the sandbox are always respected. Launch on a path (not a host) to confine the run to that subtree.
- It doesn't download the pictures. A page names dozens of images, fonts, tracks and archives; each costs a request and a full body download for bytes no extractor can read, and each used to spend the crawl's page budget too. Discover records their directory (
/uploads/is still swept because/uploads/photo.jpgwas linked) and skips the download, reporting the count asassetsin the headless run summary (assets_skippedover MCP).--assets,crawl_assets: true, or the fetch images/fonts/media checkbox turns them back on. - Connections are reused. A brute-force pass is one request per wordlist entry per directory, and each one used to pay its own TCP handshake (plus, on https, its own TLS handshake). Discover now keeps a keep-alive connection per origin, so the run pays one handshake per worker instead. Turn it off with the reuse connections checkbox,
--no-keep-alive, orkeep_alive: falsewhen the target behaves per-connection (a connection-scoped rate limit, a load balancer pinning by connection).
Each run reports its FP/FN figures: how many probes the calibrator suppressed, how much exploration the traps guards cut, and the confidence spread of what it kept.
Headless, it's gori run discover, and it's exposed to agents over MCP (discover_start / discover_status / discover_results / discover_stop):
gori run discover --target https://target.example \
  --max-depth 3 \
  --extensions php,json,bak \
  --format jsonl
Discover sends real, unsolicited traffic to the target. Only run it against systems you are authorized to test.
From the Sitemap,
Spacealso offers Send to Repeater, which opens the selected endpoint's captured request in the Repeater workbench.
Issues
Issues is your triage list. Promote anything worth tracking (from Probe, the Fuzzer, the Miner, or your own inspection) into an issue with a severity and a status, and jump straight back to the evidence flow. Issues can be exported for reporting:
gori run issues --format markdown --export report.md
gori run issues --format sarif --export issues.sarif   # for GitHub code scanning / a CI dashboard
In the TUI, ⇧E asks for the format and then the destination path. See Export the report for what a SARIF result carries.
⇧X (or Space → X) clears the tab: every issue in the project, with its notes, CVSS score and related links (frozen copies stay in the Evidence archive). It asks first and names the total, which is the whole project, not the rows a filter is showing and not the marked set, so it is the one issues key that ignores both. ⇧X is the same clear-all key History, Probe, Authorize and the ACTIVITY feed answer, each in its own tab.
Marking issues (multi-select)
The list marks the same way History does. Press t to mark the issue under the cursor and step down, so a run of t marks consecutive rows. Shift-↑ / Shift-↓ extend a contiguous range from where you started, Shift-T marks everything the current filter shows, and Esc clears the marks. Marked rows get a full bar in the gutter and the filter row shows a live 3 marked count.
Letting go of Shift ends the range: a plain ↑ / ↓ (or PgUp / PgDn, or a click on another row) hands the range back and moves on, the way a GUI list collapses its highlight. Marks you placed deliberately with t or Shift-T stay, which is what makes a discontiguous set possible. The mouse wheel only scrolls, so it never drops a mark.
Marks change what the space menu acts on, not which actions exist:
the effective target is the marks if any are set, else the cursor row
So / status:open severity:low → Shift-T → Space → C → false-positive re-triages the whole batch in one pick. The menu title reads SPACE · 3 MARKED and the entries rename themselves (Delete 3 issues) so a batch is never a surprise.
| Action | Key | Over marks |
|---|---|---|
| Set severity | Space s |
One pick, written to every marked issue |
| Set status | Space C |
One pick: the bulk false-positive / resolved pass |
| Delete | Space d |
One confirm for the whole set |
Marks survive a filter change, a re-sort (including the one your own severity edit causes), and leaving the tab and coming back; the count chip tells you how many are currently off-screen. Opening an issue pins the actions to that one issue; marks are a list-level idea. Export always writes the full report, so its menu entry says (all) while marks are set.
Notes & Comparer
Two more tools round out analysis:
-
Notes: free-form, per-project Markdown documents (multiple notes per project). Create, edit, and close notes from the Notes tab; headless,
gori run notes/gori run notes --alllist or dump them andgori run notes create/update/append/deletewrite them. Agents can manage notes over MCP (list_notes,get_note,create_note, …). -
Comparer: load two messages into slots A and B for a side-by-side diff, useful for spotting how a response changed between requests. The tab is off the bar by default: press
0and type "comparer", or send a flow to it.A slot is filled from anywhere that holds a request and a response:
Space>c(Send flow to… → Send to Comparer) from History, the Sitemap, a Repeater tab (its last send) or a Fuzzer result row, ora/bon the Comparer tab itself to pick a captured flow. That picker follows the active Scope lens, like History and the Sitemap, so turn the lens off to reach an out-of-scope flow. A Repeater send and a fuzz row leave no capture behind, so this is the only route those two have into a diff.Each column header carries that side's
status · size · time, and the divider between them states the A→B delta; a403 → 200is usually the whole answer, before a body line is read.Inside the diff:
Key Action ←/→Diff the requests or the responses ⇧N/⇧PJump to the next / previous changed row (wraps; the footer shows 3/8)SpaceZzFold the unchanged runs to ⋯ N unchanged lines ⋯, keeping 3 lines of context (Display… → Fold unchanged)↑/↓,⇧↑/⇧↓Move the row cursor · grow a whole-row selection yCopy the selection, or the whole diff, as unified text ⇧←/⇧→Scroll both columns sideways together wSwap A ⇄ B On a changed row only the parts that actually differ are lit red/green; what both sides share is dimmed, so a re-signed token or one flipped JSON value is visible without reading the line.
Diff: what changed since last time
The Comparer diffs two messages. Retesting asks the same question one level up (what changed since the last engagement?), and that is the Diff sub-tab under Target, which keys on the Sitemap's folding.
Slots hold projects, not flows: a picks the baseline (the earlier engagement), b defaults to the project you have open, w swaps them, and Ctrl-R re-runs the read. Nothing is sent; both sides are captured traffic. Rows are endpoints, and ↵ (or →) hands the selected endpoint's capture from each side to the Comparer for the byte-level answer.
Endpoint identity is the whole game. Two engagements never capture the same identifiers, so a diff keyed on literal paths reports every row twice (once removed, once added) and tells you nothing. Endpoints are therefore keyed by the same folded template the Sitemap draws: /users/{uuid}, /items/{n}, /search with its query variants folded on. The fold runs over the union of both sides, so a route that met the fold threshold on only one side still matches itself on the other.
Five verdicts, and the split between the last two is the point:
| Verdict | Meaning |
|---|---|
added |
Captured in B, never captured in A |
gone |
Captured in both, and every answer B got was 404/410 where A was reachable |
changed |
Captured in both; status class, auth, content type, or size moved beyond tolerance |
same |
Captured in both, equivalent |
not seen |
In A, and B captured no request to it at all: a coverage gap, not evidence of removal |
A thinner retest visits fewer endpoints. Collapsing "we did not go there" into "it is gone" would report a short afternoon as a wave of fixes, so the two are different verdicts and the caveat sits on the header where it cannot scroll away. Both sides' flow, endpoint and host counts print beside the numbers for the same reason.
changed is judged by a tolerance band (the same calibration the Repeater's minimizer and the Miner use), not byte equality, so a page whose length wanders between captures reads as unchanged. Status is compared by class, so a 200 that became a 201 is not a finding while a 200 that became a 403 is (the auth axis names it, ahead of the status move).
v cycles the verdict lens; the counts always cover all five whatever the lens shows. Headless, it is gori run diff (with --format md the report is a section you paste into the deliverable), and over MCP it is diff_projects.
A row is meant to leave the tab. A retest's deliverable is a list of findings and this is the tab that produces its input, so ⇧F files the selected endpoint as an Issue and n records it as a Note: same text, one without the form, and neither moves you off the list. Both carry what only this tab knows: which two projects were compared and where their databases are, what each side actually answered, and which axis moved. The capture behind the side that is your open project is linked as evidence, not copied; the other side's flow is named with its database, because entity_links do not cross projects. A not seen row files as info and says in its own words that the newer capture never requested the endpoint; it will not claim a removal the diff did not observe. The same sentence rides on every row of --format json, so an agent filing one issue per row cannot lose the distinction either.
Issues, notes, repeaters, and fuzz/miner sessions can be linked so you jump from an issue straight back to the evidence flow or the session that produced it. Issues record an optional CVSS vector or numeric score, and the severity follows from it, visible in the Issues list, in cvss:>=7 filters, and in every export. Space → Set CVSS on an issue (or ↵ on the cvss row of the issue form) opens the calculator: type or paste a vector (or a bare score like 8.8) into its vector: row, or build one from the base metrics with ←/→, and the two stay in step. The version: row picks 3.1 or 4.0; each keeps its own selections, because the two versions ask different questions (v4.0 adds Attack Requirements and splits impact into Vulnerable/Subsequent systems) and are not convertible. A pasted vector opens on its own version, and any version the parser knows, including v2, is stored and scored as typed even though the builder only writes 3.1 and 4.0. Space → Link… from History, the Repeater, the Fuzzer, or the Miner opens one card holding every issue and every note, with + New issue… / + New note… pinned above them, so filing a brand-new issue for what you are looking at, already linked, is the same keystroke as attaching it to an existing one. Type to filter by title, host, status, or the words issue / note; whatever you typed becomes the new issue's title if you land on the create row.
A link is a pointer, and both things it can point at are mutable: a Repeater tab holds one response and the next send replaces it, and a History flow is one retention sweep from (gone). So Link… keeps the bytes. There is one verb, not a pointer/copy pair to choose between at the moment of filing: ↵ on an issue row links the ref and freezes its current exchange (request, response, status, timing, protocol, error and truncation flags) in one transaction, and + New issue… files the issue and freezes in one go. The picker's hint says which before you press it (↵ link & freeze / ↵ link).
What ↵ does depends on what you are attaching and where:
| ref | → Issue | → Note |
|---|---|---|
| flow / Repeater tab with a response | link + freeze | link only |
| pending flow / never-sent Repeater tab | link only; the toast says not frozen: … and why |
link only |
| fuzz / miner session | link only (no single exchange) | link only |
A note owns no evidence, so it always takes the pointer alone. Nothing is ever refused for want of bytes: the link is the act, the copy is what rides along, and a toast that could not take one names the reason (linked to issue #3 · not frozen: repeater #2 has never been sent…). The drift and byte-cost questions still come first, and answering "no" to either still files the link. ⇧F (Add issue) from History freezes the same way: the marked flows are copied as the form opens.
On an issue that is already linked, f on a live row of its RELATED card (or f in Space → Manage links) freezes that link. Use it for links made before this rule, links filed while the source had no exchange, and links added headless. RELATED lists LIVE and FROZEN rows apart. A frozen row names its source (hist #12, repeater #3), the time of the copy, its status and size.
RELATED holds everything that backs the issue, and its first row is the flow the issue was filed from. There is no separate evidence or flow line above the card: an issue relates to traffic four ways (the flow it was filed from, its other links, the frozen copies, the retest steps), and the first three are one list, in that order. The first row is live-badged like any other pointer, so s opens it in History, ↵ shows its bytes, and f freezes them. (o used to be a second key for that same jump and is gone.) r sends the row under the cursor to the Repeater (a live flow's capture, or a FROZEN row's frozen request, neither of them sent) and falls back to the first flow row when the cursor is on a session. An issue filed from a flow this project no longer has shows the row as (gone); deleting the flow itself clears the issue's pointer with it.
In RELATED, ↵ shows and s goes. ↵ opens the selected row's exchange in a read-only viewer over the detail: the frozen bytes on a FROZEN row, and on a LIVE one the source as it is now (↹ swaps request/response, y copies the shown pane, esc lands back on the row you pressed it from). A live view says so in its title (LIVE hist #12) and on its provenance line (as it is now · not frozen), because retention or the next send can still change what it shows; f inside it freezes what is on screen and the card becomes FROZEN EVIDENCE #N without closing. s is the other half: it opens the row's source in its own tab: History for a flow, the Repeater/Fuzzer/Miner tab for a session, and for a frozen row the original it was copied from when that is still the same object. A fuzz or miner row is the exception ↵ names in the hint (↵ open session): a session is a template plus a run, with no single exchange to show, so ↵ opens it. A row whose source is gone, or a Repeater tab that has never been sent, says so instead.
After the first snapshot exists, you can enable the optional Evidence tab in the tab settings. It lists the whole project archive and filters on issue:, host:, method:, status:, confirmation:, source: and date:. Open the linked Issue or the original History/Repeater row when it still exists, or select two snapshots with c to send a before/after pair to Comparer. Copy and JSON export follow the project's body-redaction policy. r duplicates the frozen request into a new Repeater tab but does not send it. Issue links are many-to-many and mutable; unlinking the last Issue, or deleting an Issue, leaves an orphaned snapshot in the archive. Deleting the snapshot itself requires confirmation and lists every affected Issue link. Headless, gori run evidence and MCP list_evidence with no Issue named list that same archive, orphans included.
Each snapshot has a SHA-256 of its stored request and response. It is never pruned or replaced, and only its explicit delete removes it. A Repeater tab that has never been sent is refused rather than frozen request-only, as is a flow whose response has not landed yet. A copy over 1 MB shows its byte cost first, and a project's evidence is bounded at 256 MB. A Repeater copy pairs the tab's saved request (bindings unexpanded) with the last successful response the store holds. Freeze right after the send that proved the finding, when those two agree. A WebSocket copy contains its handshake, not its frame transcript. The History detail's stats line and the Repeater's RESPONSE border read frozen ×N; the source remains editable and its next send can still replace its response.
Retest: the check a finding carries
Frozen evidence keeps what proved a finding; a retest is what runs it again. It is a small ordered list of Repeater sends on the Issue, each with a role and at most one expected result. It is what an issue's write-up is trying to say when it reads "send #4 first to log in, then #5 should answer 403, and #6 is the control".
Press ⇧R (Retest…) on the Issue detail. a picks any Repeater session (it does not have to be linked to the issue), its role (setup establishes the precondition, baseline is the anchor a body comparison is made against, variant is the case under test, control the negative case, cleanup the undo), and the one result you expect: a status (status:403, status:2xx, status:200-299), a JSON field (json:data.role=admin, json-absent:data.token), or a comparison with the baseline (body:same, body:diff). A JSON path reads the way --jsonpath and session bindings read it (data.role, $.items[0].id, items.0, ["a.b"]), and a path gori cannot read (.., *, a filter, an unclosed bracket) is refused when you add the step, rather than stored and later read as absent, which a json-absent: would report as a pass. Leave it empty to record the outcome and assert nothing, which is what a login step or a cleanup wants. ⇧J / ⇧K reorder, e edits, d removes, r runs, and ⇧R runs while permitting the cleanup steps after a refused send.
↹ swaps the card between the plan and the last run's result table: role, session, what was expected, what actually happened, and pass or fail per step. ↵ on a result row opens the History flow that step's own send recorded: the exact response the row reports, which stays openable long after the Repeater tab has moved on, because a retest never overwrites the tab's stored response. The Issue detail carries a one-line summary (retest 3 steps · last FAIL …) once an issue has one, and nothing at all when it does not.
A step sends whatever its Repeater tab holds at the moment of the run. That is the difference from freezing: evidence is the request as it was, a retest tracks the request as it is fixed.
Every send goes through the project's scope and Sandbox gates and is recorded in History as src:retest, carrying the issue and step number. Before a batch that contains a state-changing method, gori names the exact request count and asks, because each of those re-runs its side effect on the target. Once gori refuses a send, the rest of the run is skipped, cleanup steps included, unless the operator permitted them (⇧R here, --allow-cleanup / allow_cleanup headless): skipped rows say why, so a partial run cannot read as a pass. A setup step that fails halts the measurement steps but still lets cleanup run, and a body: comparison is inconclusive rather than a pass both when no baseline is behind it and when the last baseline step missed its own expected result: a baseline that did not establish its reading anchors nothing. The verdict is pass only when every step ran and every assertion was decided; the newest 20 runs per Issue are kept.
Headless it is gori run retest (run exits 0 only on pass, so a fix's CI job can gate on it), and over MCP list_retest_steps / add_retest_step / run_retest / list_retest_runs / get_retest_run.
Next Steps
- MCP Server: let an agent run scans and read issues
- CLI Reference:
probe,mine,issues, andnotesflags - Probe Rules: every built-in scan rule by id
- Query Language: scope your scans